

To inspect an element in Chrome, right-click the text, image, or button you want to check and select Inspect. Chrome opens the Elements panel and highlights the corresponding part of the page. From there, you can see which CSS rules apply to it and try changes without editing the live site.
Say you want to replace Get Started with Start Your Free Trial, but you’re not sure whether the longer label will fit on a phone. You can edit the text in your browser, shrink the viewport, and see what happens before changing any site files. This guide shows you where to find Inspect in four desktop browsers and walks through that button edit in Chrome.
What Is Inspect Element?

Inspect Element is a feature in your browser’s developer tools that lets you examine a specific part of a web page. If you inspect a button, for example, you can see whether it’s a <button> or a link styled to look like one. You can also find the rule that controls its spacing and temporarily change the text or styles.
View Page Source shows the HTML your browser originally received. Inspect Element shows the live DOM, the page structure as it exists in your browser right now.
Suppose a Continue button appears only after you select a plan. If JavaScript creates the button at that point, you won’t find its markup in the original HTML. Once it appears, right-click it and select Inspect to find it in the live DOM.
What Can You Use Inspect Element For?
A short label doesn’t always mean a narrow button. Select the button and check its box model to see how much space comes from the content and how much comes from padding. If the button itself looks fine but sits too far from the next element, check its margin and the parent layout’s gap instead.
Preview copy before publishing
A label like Start Your Free Trial might fit on desktop but wrap where Get Started fits on one line. Replace the label in the inspector and narrow the viewport to see where the layout changes. If the longer label wraps or gets clipped, you can try shorter copy or adjust the spacing before updating the page.
Check how an element is marked up
A line of text can look like a page heading without being marked up as one. Inspect it to see whether it’s an <h1>, another heading level, or a styled <div>. You can also inspect an image to check whether it has an alt attribute and whether its value makes sense for the image’s purpose.
Write a bug report someone can reproduce
“The button wraps on mobile” doesn’t tell a developer where to start. Include the page URL, browser, and viewport width where you saw the issue. If you found a relevant CSS value in Computed, include it too. For example: “At 375 px in Chrome, the button label wraps onto two lines. The button has 24 px of padding on each side.”
How to Inspect Element on Android and iPhone
Use a desktop preview if you only need to check the layout at a narrower width. If the issue happens on a real phone but not in the preview, connect the phone and inspect the page while it runs on that device.
Preview a mobile layout in Chrome
Open DevTools and click Toggle device toolbar to enter Device Mode. Choose Responsive, set the viewport to a width such as 375 px, and see whether the longer button label still fits. This tests the layout at that width; it doesn’t reproduce every behavior of a real phone.
Inspect a page on Android
Enable USB debugging in Android’s Developer options, connect the phone to your computer with a data-capable USB cable, and approve the debugging prompt. Open the page in Chrome on the phone. In desktop Chrome, go to chrome://inspect/#devices, find the phone’s tab, and click Inspect. If the tab doesn’t appear, check Chrome’s remote debugging setup.
Inspect a page on iPhone or iPad
On the device, go to Settings → Apps → Safari → Advanced and turn on Web Inspector. Connect the device to a Mac, approve the trust prompt if prompted, and open the page in Safari on the device. In Safari on the Mac, open Develop, select the device, then select the page.
How to Open Inspect Element on Desktop
Right-click the part of the page you want to inspect, such as a button or heading, and choose Inspect or Inspect Element. The browser opens its developer tools and highlights the corresponding element so you don’t have to search through the page’s HTML.
Master proxy setup, integration and performance optimization quickly with IPFLY guides
Chrome
Chrome highlights the selected element in the Elements panel. If you want to pick another element without opening the right-click menu again, press Ctrl+Shift+C on Windows or Command+Option+C on Mac to enter Inspect mode. Hover over the page to preview what Chrome will select, then click the element.
Edge
After you select Inspect, the Elements tool opens with the element highlighted in the DOM tree. Use Styles to see which CSS rules match it, or Computed to see the values Edge actually applies.
Firefox
Choose Inspect to open the Firefox Inspector. Firefox calls this panel Inspector, rather than Elements. With the element selected, look in Rules to see its CSS declarations.
Safari on Mac
If Inspect Element is missing from the right-click menu, open Safari → Settings → Advanced and turn on Show features for web developers. Once Safari developer tools are enabled, right-click the element again and choose Inspect Element to open Web Inspector.
How to Use Inspect Element: A Step-by-Step Example
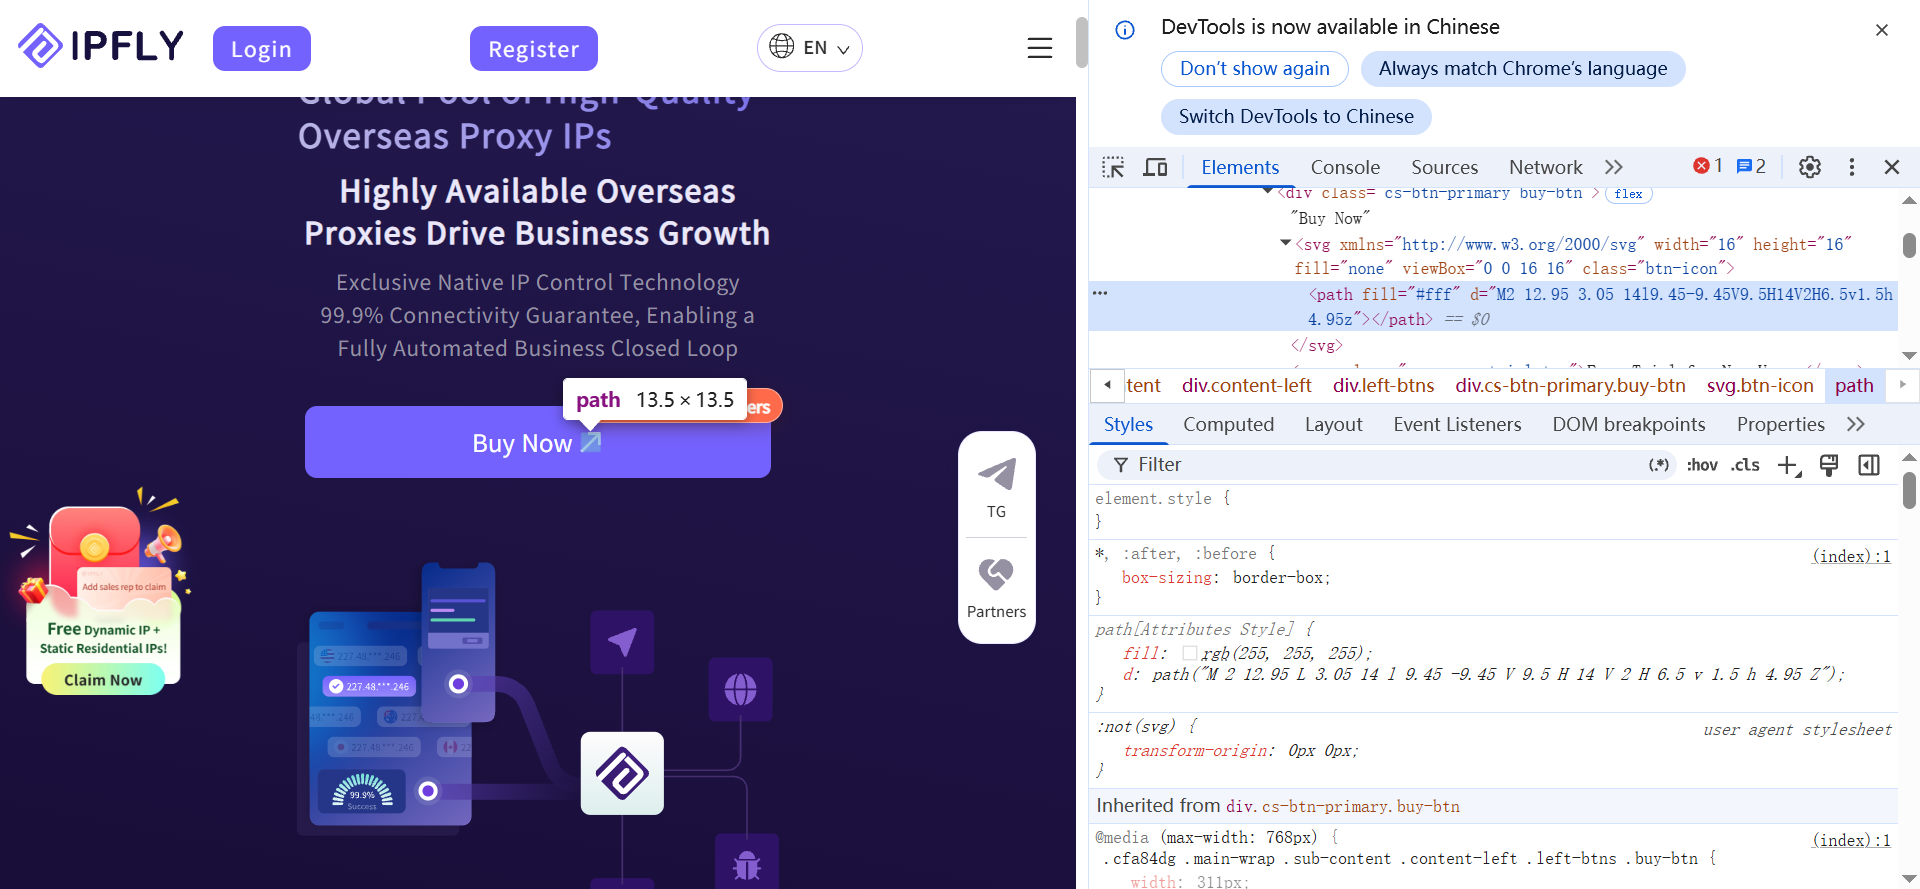
Open a page with a Get Started button. Right-click it and select Inspect. In Elements, look at the highlighted line. If it’s a <span> that holds only the label, select the enclosing <button> or <a> to inspect the full clickable area.
2. Find the CSS that controls its spacing
With the button selected, filter the Styles pane for padding. Then switch to Computed to check the final values. If you’re investigating width, start with padding-left and padding-right. The box model shows whether the space is inside the button’s border (padding) or outside it (margin).
3. Change the label and test the layout
In the DOM tree, double-click the label text, replace Get Started with Start Your Free Trial, and press Enter. Narrow the viewport and see whether the text wraps or gets clipped. If the label is close to fitting, try reducing the horizontal padding in Styles and compare the result at the same width.
Refresh the page when you’re done. Ordinary edits in the inspector disappear on reload because they haven’t changed the site’s files.
How to Compare Page Elements Across Regions

What if the button doesn’t just wrap differently, but shows different text? Suppose the same URL displays Start Your Free Trial in the US and View Plans in the UK. Before treating this as a layout bug, check whether the site is serving different content to each region.
If you suspect the site uses the visitor’s IP location, use IPFLY to load the same URL from each region. Keep the browser language, login state, and viewport width the same, and use comparable cookie settings. Inspect the button in both sessions. If the DOM contains different labels, you’re looking at a content difference, not just a spacing issue. That comparison tells you what changed, but it doesn’t prove that IP location was the reason.
Frequently Asked Questions
Why can’t I find Inspect Element?
Open DevTools from your browser’s menu and use the element picker. In Safari, enable developer features first.
What’s the shortcut for Inspect Element?
In Chrome, press Ctrl+Shift+C on Windows or Command+Option+C on Mac, then click the element.
Why isn’t my CSS change showing up?
Check that you selected the right element, then open Computed to see which value the browser applied.
Are Inspect Element changes permanent?
No. Ordinary edits affect only your browser and disappear when you reload the page.
Can I inspect elements on a phone?
Yes. You can inspect Chrome on Android from desktop Chrome, or Safari on an iPhone from Safari on a Mac.
Conclusion
Right-click an element and select Inspect to see how it’s built and which styles it uses. Try it on a button on your site: preview a longer label, narrow the viewport, and note where the text wraps. You’ll know what needs adjusting before you touch the site’s code.